The Mars is a set-and-forget record-breaking EA which at this moment last 12 months with 770% consecutive profit !! You will not find anything like this on the whole internet with a verified track record on a live accounts.
The Mars EA has the astonishing track record 770% in last 12 months..
Why is The Mars EA so successful? Because it uses real market mechanics of Interbank Price Delivery Algo.
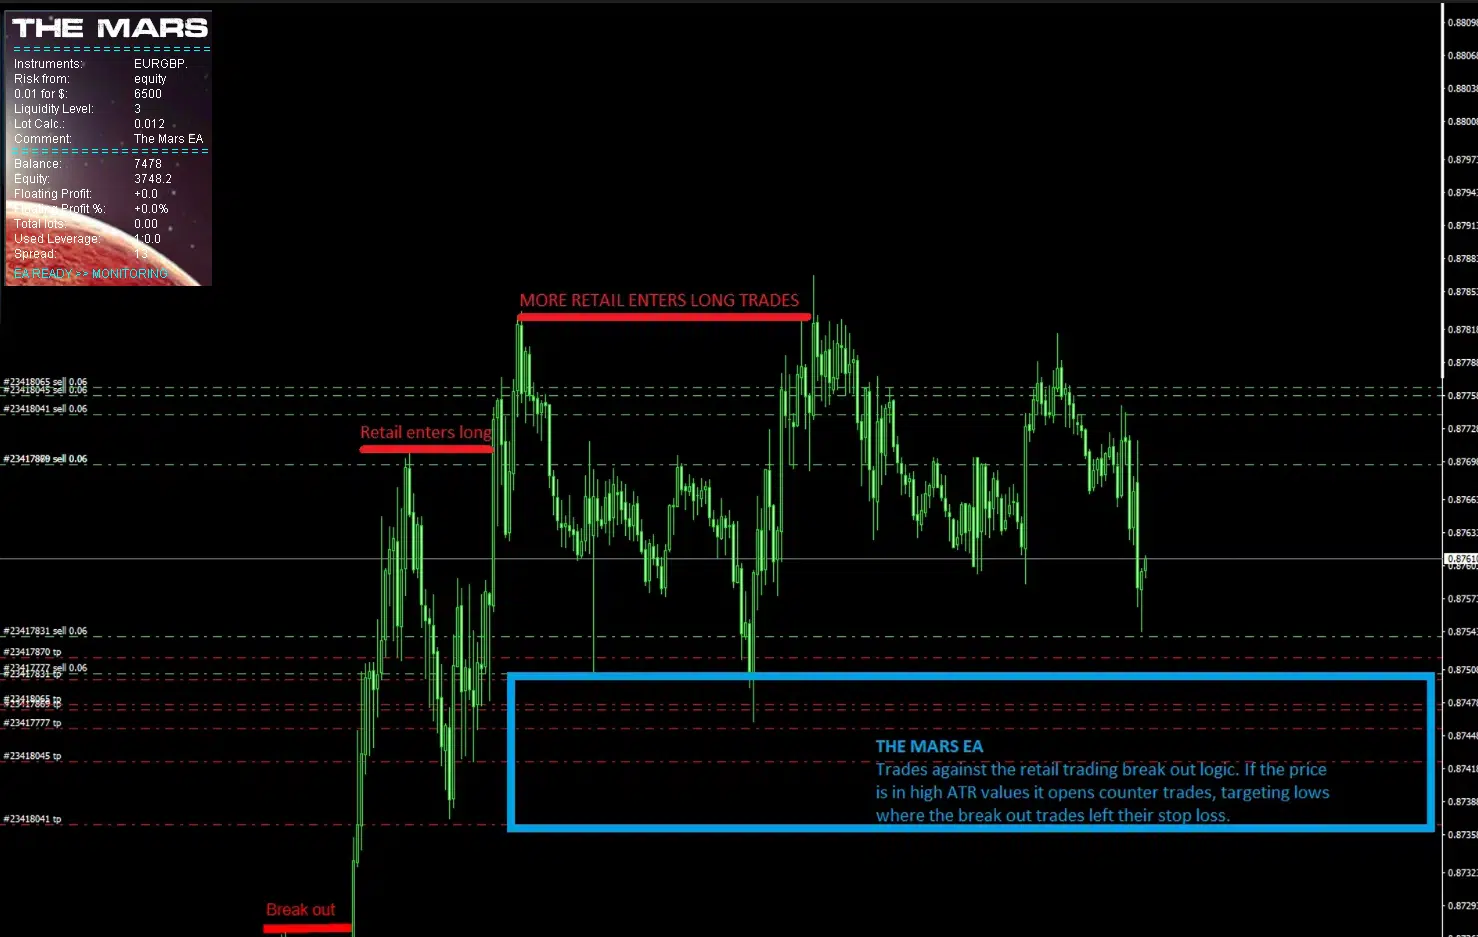
Let me try to explain. Trading system that employs multiple independent grid sequences of orders in trading against retail break-out trading logics on specific liquidity levels. The EA is monitoring the breakouts of the levels in the oversold and overbought areas where the FOMO retail traders enter the market after confirmation as it’s taught in every stupid trading book. When this situation occurs EA trades against these retail positions with the targets to stop loss clusters (liquidity zones) below/above swing lows/highs where mostly their stop losses are placed.
Markets especially the Forex market are highly manipulated by large speculators and driven by central bankers’ IPDA (Interbank Price Delivery Algo). Currencies are the products of central banks, and they dictate the price, no matter how much any group buys or sells. IPDA deliver price where it’s needed and where it does business. IPDA is constantly seeking liquidity which can be in the form of stop losses of retail traders. That is actually great because by understanding retail traders’ behaviour we know where the liquidity is and where the IPDA will most likely take the price next. The worst entries to the markets mostly have break-out traders and that’s what The Mars EA trades against with a little help from the grid.
Where is the liquidity resting in the marketplace?
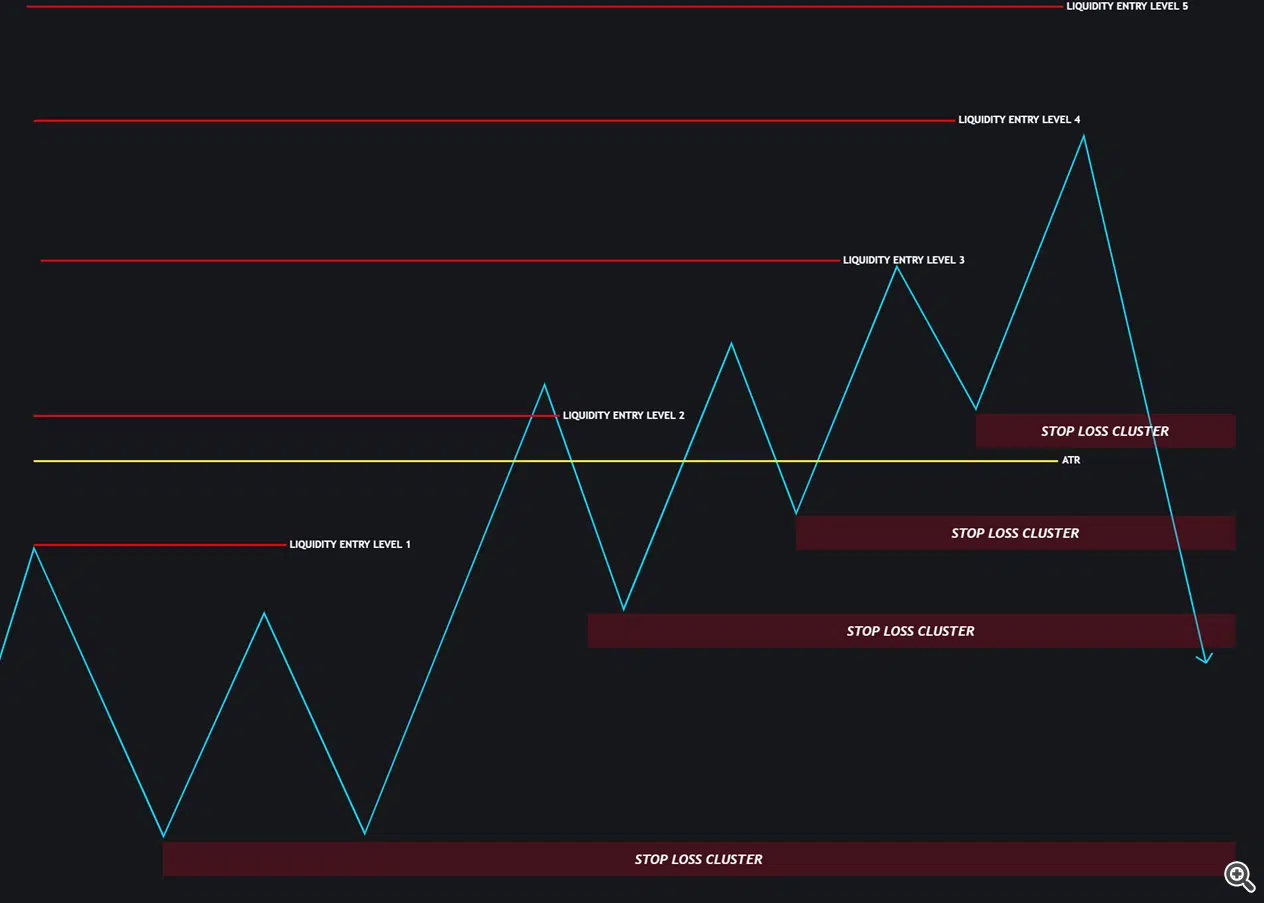
Traders often place their stops in similar zones below swing lows which creates a stop loss cluster = Liquidity. This is where Large speculators are filling their orders. The stop losses of buyers are actually a sell stop. Large speculators need someone to sell so they can buy, that’s why the price very often drops to these liquidity zones before the expansion move and that’s the market movements in which The Mars EA wants to participate with multiple positions and targets to the liquidity zone.

-
- Break of the consolidations, break out traders entering the market and they put their SL below the last swing low.
- After the price breaks and pullbacks back to the old high. Another group of traders is entering with SL bellow swing lows as they learned in the books.
- The break of the old high brings another group of traders who are entering the third wave again. They put stops below the latest or previous swing low.
- Totally worst entry has FOMO traders who see the market flying and they want to catch it, these mostly enter on the top/bottom of the mean reversal.
As you can see in the picture. Two breakouts with new highs induced 3 groups of traders to enter the market, but they entered late or too early (before the liquidity loaded). This is a disadvantage of break-out trading. I don’t say it’s not working. But mostly if break out is close to the daily ATR high/low levels it’s fake. And trading against break-out systems gives more probabilities and profitability in the long term. The Mars EA takes these advantages with multiple independent grid sequences of orders to target the groups’ Break-out systems.
In the picture below you can see how the EA is placing the trades once the price breaks new highs in the overbought conditions above the daily ATR and in the pre-determined liquidity levels. Which we can adjust in the EA settings. For better understanding, I recommend running visual backrests.
Liquidity Entry Levels
The Mars EA trades against the breakout traders, but oversold /overbought conditions filtered by the ATR must be met as well. More waves of break out mean more inducements and more traders in the markets means bigger stop loss clusters (liquidity) below swing lows. We know that after inducement the manipulation will most likely come, but the FX market is not centralized and we don’t know if the volume in stop loss clusters is already big enough for large speculators to fill their orders. We can speculate on coming manipulation at specific levels, but we really never know when it will come. That’s why the EA employs the sequences of trades in the grid to average our entry and diversify the targets. We do not want to have just a stupid grid that adds positions with some predefined pips gaps so we can set the efficiency of the EA for entering specific liquidity levels. Which gives different probabilities and accuracy as you can see in the variable 10 years back tests.
Liquidity Entry Levels Logic
Generally, we can use 2 rules below
-
-
- High Liquidity level – Better accuracy, Fewer trades, Less drawdown
- Low Liquidity level – More trades, higher drawdown, Less accuracy
-
The most optimal Entry level is liquidity level 3. Lower levels are high risk. Higher levels have fewer trades, but more accuracy
-
-
- Liquidity Entry Level 1 – The level where the first countertrend traders enter, the market can start reversing from here but mostly it’s too early
- Liquidity Entry Level 2 – slightly below daily H/L, it gives more trades but still it’s less accurate, we skip this one as well
- Liquidity Entry Level 3 – slightly above daily ATR and Standard deviation – the best entry oversold/overbought conditions
- Liquidity Entry Level 4 – higher above daily ATR and with these settings. This offers very few trades on our commodity portfolios
-
Power of commodity pairs!
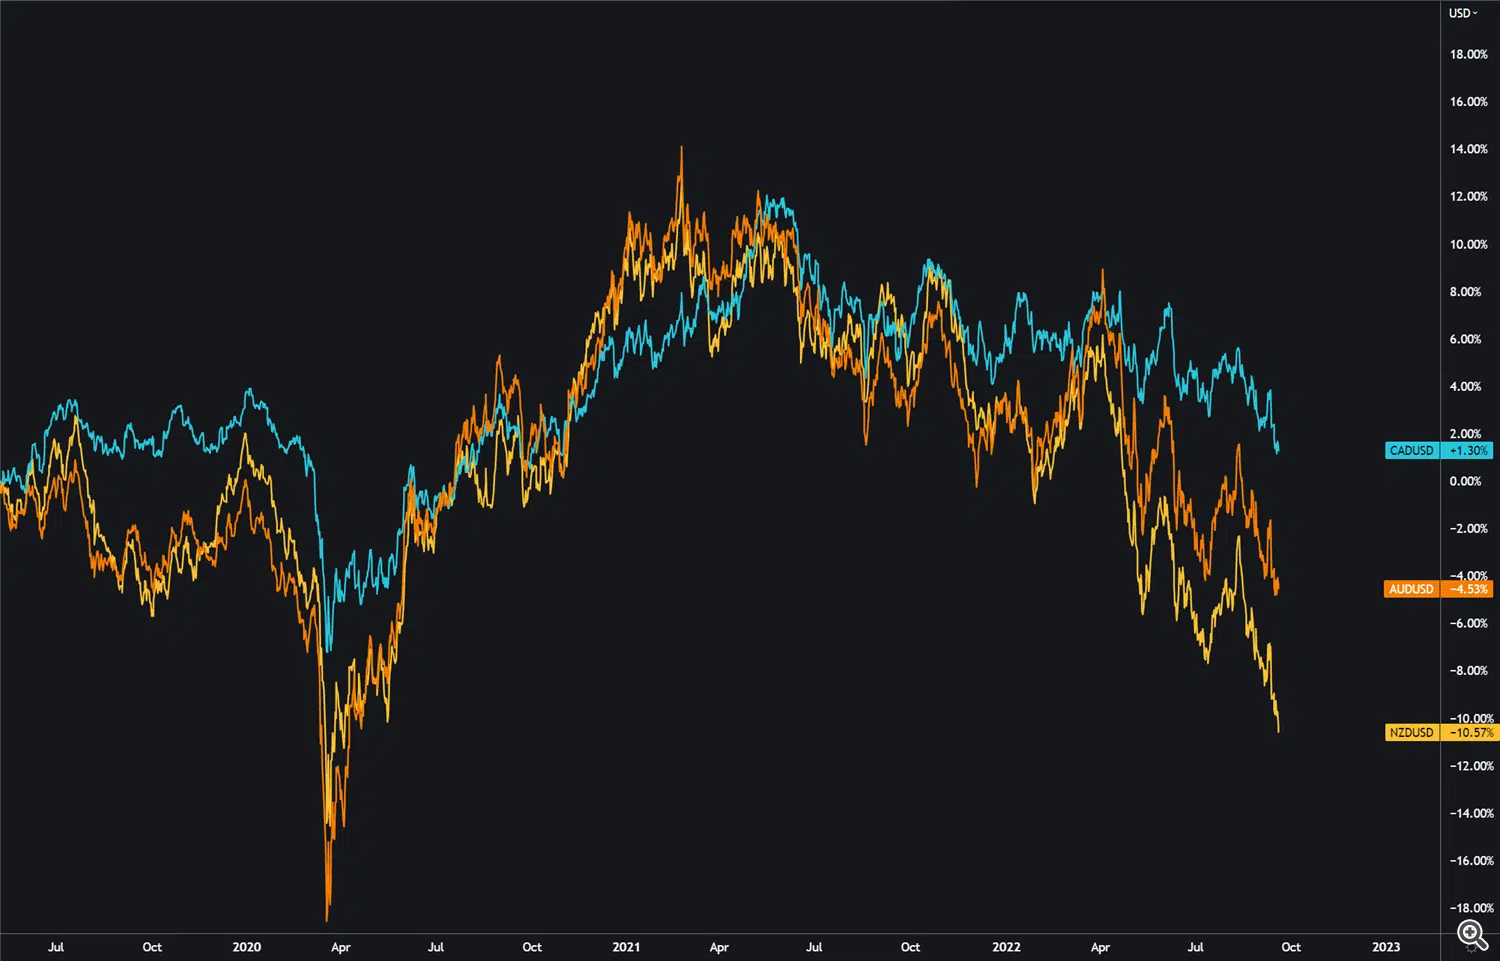
The Mars EA is a flexible system that can trade any FX pair, but the most stability it delivers on the commodity pairs triangle AUD/NZD, NZD/CAD, and AUD/CAD These three correlate together (see a picture below). There are only a few situations during the years when some of the currencies move faster than others against the USD and each other. But the deviation and correlation always come back together. So these 3 pairs are enough to make stable gains every month with relatively low risk.
Capital Guard
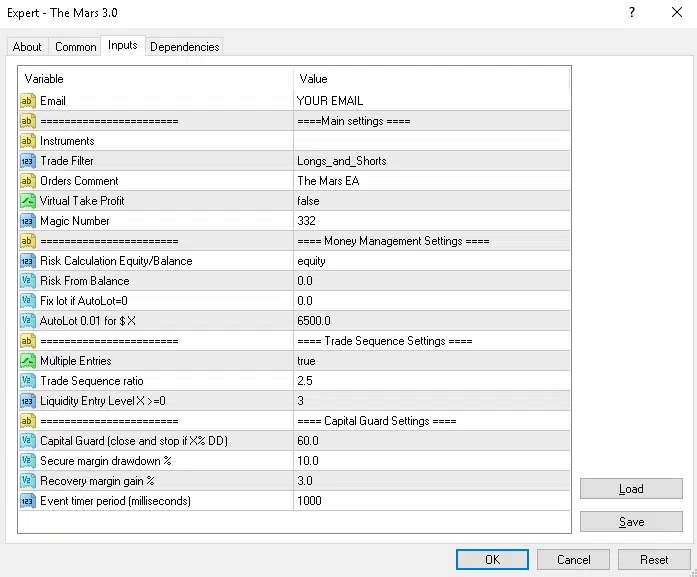
EA has implemented capital guard protections, which have a couple of settings that don’t allow drawdown on all the pairs at the same moment or close all positions and stop trading when X% DD occurs in case of the black swan event.
-
-
- Capital Guard (close and stop if X%DD) – 60 – If the value of 60 %DD (drawdown) is reached the EA will close all trades and stop trading
- Secure margin drawdown – 15 if the value of 15 %DD is reached the EA will not start trading on other pairs where the sequences of trades are not open yet until the %DD drops back to the value of Recovery margin gain which 3rd settings in capital guard
- Recovery margin gain % – 5 – the value of the drawdown, when the EA opens the trades on all pairs trading, was blocked by secured margin before.
- Event Timer Period (milliseconds) – 1000 – specifies how often the EA should check the account
-
What to expect?
First of all, this is not a quick-rich EA. But based on my live results and backtest you can get a stable partial income. In my opinion, the backtest really never mirrors the real trading conditions, so I better calculated with deviations to 15% higher drawdown and 15% lower profits than what’s the outcome of the back tests.
10-year backtests with most two optimal settings performed an average yearly profit of 79 – 186% with, a max drawdown of 35% in the extreme conditions for the single pair. Which is amazing results. It’s of course not guaranteed that we will get the same results in the future, but the statistical edge is only what we have as traders.
The Mars Secure margin drawdown function doesn’t allow the drawdown to happen at the same moment on all pairs. My calculations for the worst-case drawdown with an optimal portfolio would be below 45%. So, with relatively conservative settings we can expect between 5 -10% monthly average with the usual drawdown of 15% and our worst drawdown should not exceed 45%.
On the tab below you can see 10 years of backtests of the single pairs with the different auto lot settings. On the right side of the tab are the calculated average yearly profit and drawdowns.

* This is the backtest based on the 10 years of history. Note that the world is in a recession. The market can behave differently.
Installation
Installation is very easy, you will simply. Put the file into the Experts folder and then drag and drop to the M15 chart of AUD/CAD, NZDCAD, and AUDNZD, and choose your settings.
All the settings mentioned above were implemented to the EA and the only thing you need to do is to pick up what fits you most. If you need help you can, of course, contact me anytime but I’m sure if you watch my video guide you will make it.
Click here to watch the video guide![]()
Account Requirements
MT4 Hedging Account // Leverage 1:500
The EA is not sensitive to spreads, but you should keep the trading costs as low as possible.
The recommended minimum is $500 however for less risky trading you should have at least $1000
The EA should run 24/5 on low latency Virtual Private Server. I’m using Chocoping – order your server.
THE MARS EA 3.7
- 3 Meta Trader Accounts – Account Growth: 11 840 %
- Lifetime License – Monthly average: +5%
- Free Updates – Win rate: 70%
- 3 different Trading sets – Tracked since 2019
- Easy installation with video guide
- Strategy and risk management guide
- 1 to 1 support from the developer (Dave Fx Hunter)
$599
$333