What are high-probability scalps?
Focus:
- Highlighted opportunities in scalping the forex
- Learn directional bias for HTF institutional sponsorship
- Determine the highest probable times of the day
- Framing high probability setups for runs on liquidity
- 10 – 30 pip swings
- There will be times scalping setups will overlap with long-term conditions
- Running out the previous day’s highs/lows
- Targetting buy stops above the previous day’s high or 1 / 2 days ago
- Always going to be looking previous 3 days as your range (counting the current day as day 1)
- The reason for 3 days is because every swing high/low consists of 3 individual bars
USDCAD – Example
H1 CHART
- Highlighted individual daily highs + lows
- Use Daily TF to determine bias
- Use H1 TF to look for draws on liquidity

- If we are bullish – seek to run previous day(s) highs / old highs (vice versa for bearishness)
- Known as draw on liquidity (DOL)
- Going to be in the form of buy-side liquidity or buy stops
- The market will be drawn to that level and dip into the liquidity pool
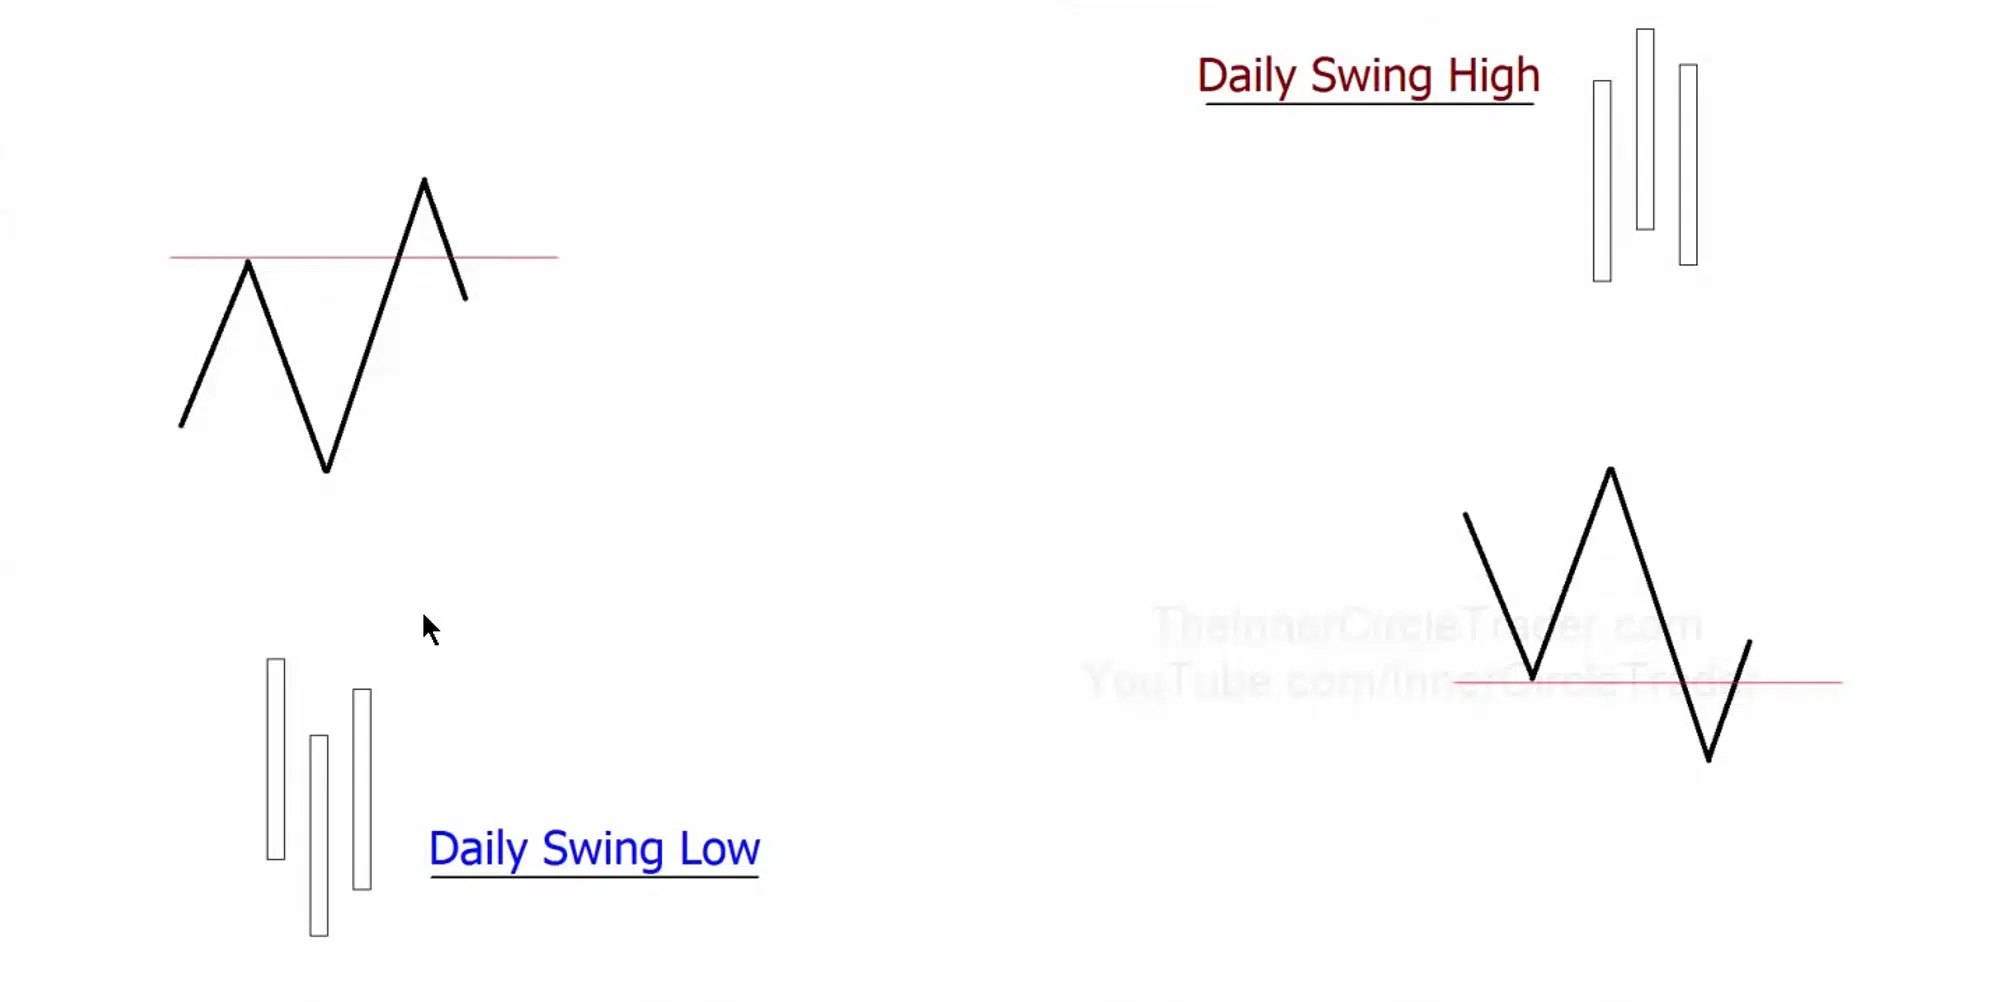
- Any of the 3 candles for swing points can be up or down close
- The formation is most important – only 3 candles are needed to form this pattern
- Daily swing low should have the middle candle being the lowest low and higher lows to the left and right
- Daily swing high should have the middle candle being the highest high and lower highs to the left and right
Bullish scenario
- Only interested in looking for a daily swing low after a daily swing high has been broken
- Once the highest high of the daily swing high is traded through – this indicates bullish momentum
- Wait for a pullback and swing low to form to show oversold conditions
- After a swing low forms we wait for the last swing candle of the 3 to be violated to the upside ⇒ We play the pullback and target the previous day(s) highs
Bearish scenario
- Only interested in looking for a daily swing high after a daily swing low has been broken
- Once the lowest low of the daily swing low is traded through – this indicates bearish momentum
- Wait for a swing high to form to show overbought conditions
- After a swing high forms we wait for the last swing candle of the 3 to be violated to the downside ⇒ We play the pullback and target the previous day(s) lows
EXAMPLE – BULLISH SCENARIO
DAILY CHART

H1 CHART (HIGHLIGHTED PURPLE ON DAILY CHART)
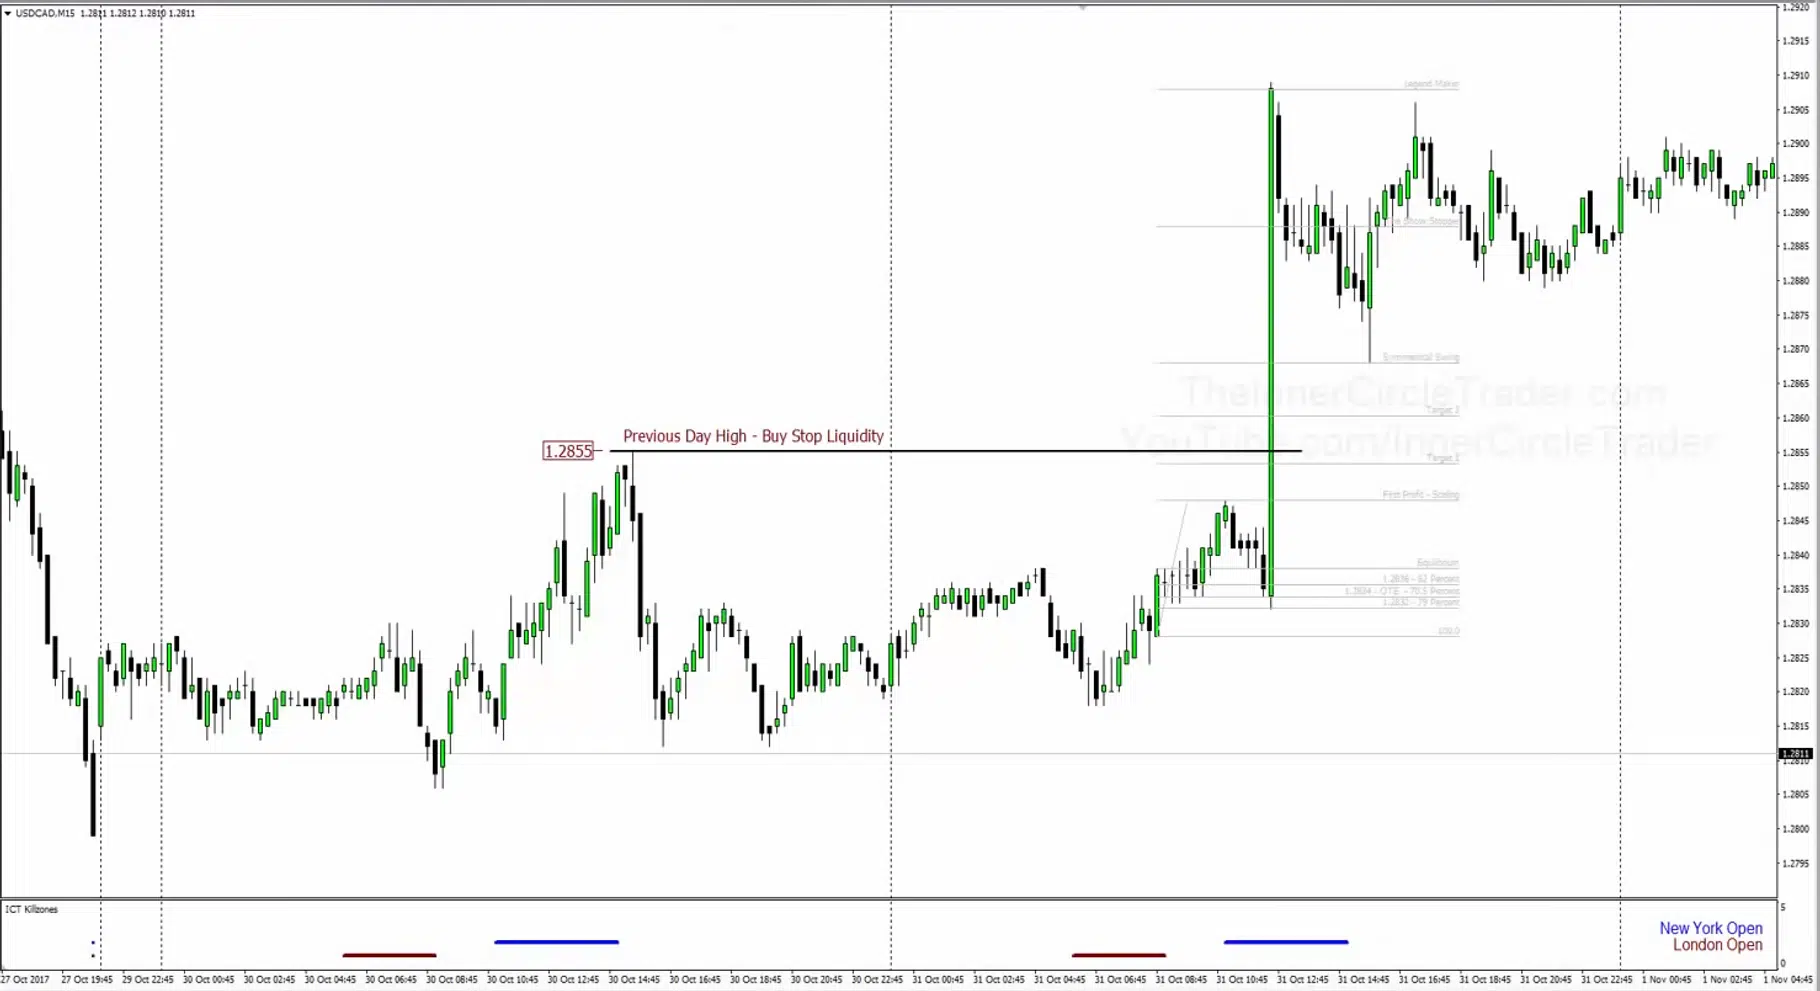
- Red line = London KZ
- Blue line = New York KZ

- As we are bullish, we expect the previous day’s high to go (denoted by the line)
- We use our fib tool to draw from the lowest body of the previous day’s range to the highest point before a retracement

- Expecting a retracement the next day into OTE
- After retracement, we can look to target the previous day’s high or our current day’s higher high – both are valid buy-side liquidity
EXAMPLE 2

Note that the entry was provided outside KZ, this makes it a low probability
Implementing daily bias
Referring to daily chart
Bullish scenario
- Wait for a swing high on the daily to be broken = Bullish stage
- Swing high = Candle with lower highs to both sides
- We anticipate buying opportunities in the future
- When price retraces, look for a swing low to form but does not break a recent swing low
- Swing low = Candle with higher lows to both sides
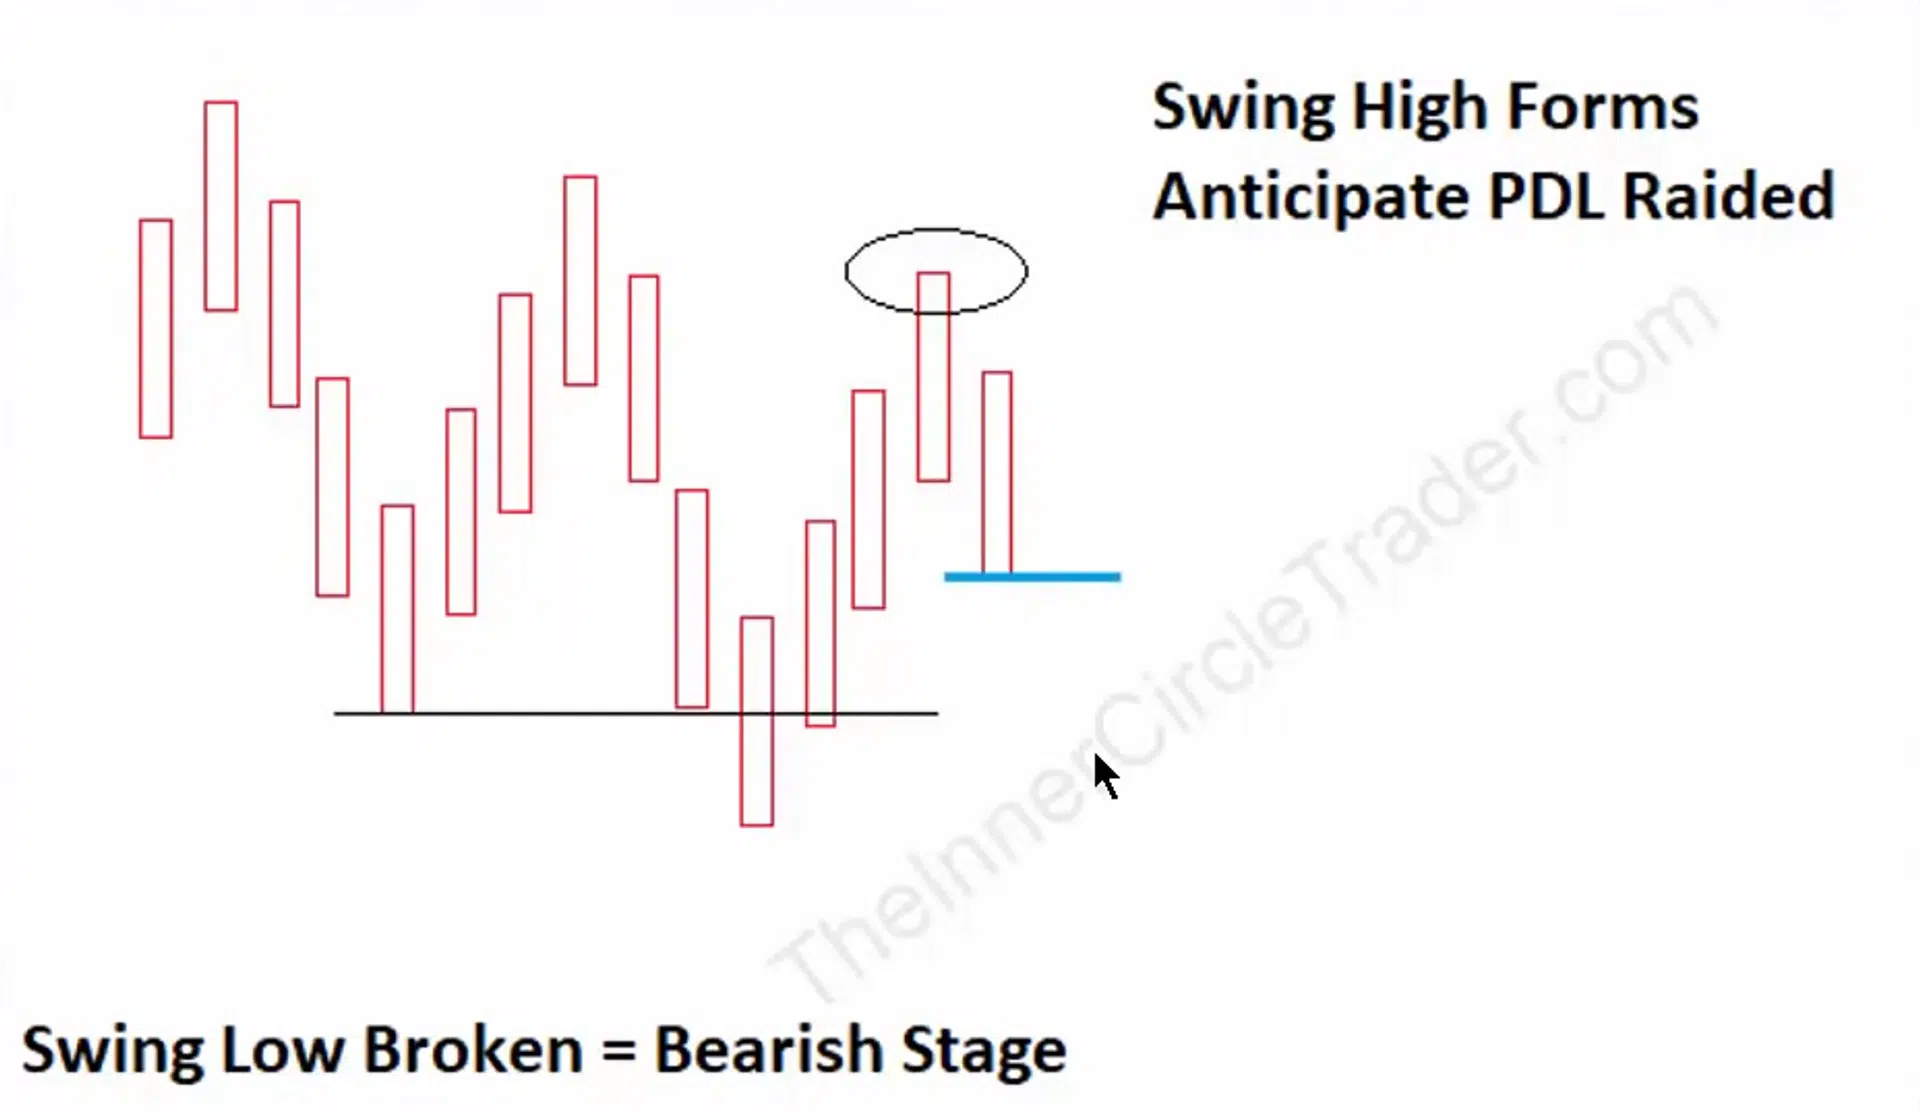
- When swing low forms – anticipate the 3rd daily candle’s (last candle of the swing low formation) high to be raided or traded through the following day
- The candle that opens after this should preferably open below the 3rd candle’s high
- Look for previous day highs to be raided each day until a swing high on the daily forms or price reaches a key S&R level

Circle is swing low Blue line is 3rd daily candle expected to be raided or traded through
Bearish scenario
- Wait for a swing low on the daily to be broken = Bearish stage
- Swing low = Candle with higher lows to both sides
- We anticipate selling opportunities in the future
- When price retraces, look for a swing high to form but does not break a recent swing high
- Swing high = Candle with lower highs to both sides
- When swing high forms – anticipate the 3rd daily candle’s (last candle of the swing high formation) low to be raided or traded through the following day
- The candle that opens after this should preferably open above the 3rd candle’s low
- Look for previous day lows to be raided each day until a swing low on the daily forms or price reaches a key S&R level
GBPUSD EXAMPLE – BULLISH
DAILY CHART
- After a swing low is created, we wait for the third daily candle’s high to be traded through before we can start looking for longs – in this example, we can be a buyer where the mouse is and target PDH
*Note: this is my personal notes from the ICT’s video. I have screenshotted and noted what is important for my studies I recommend watching the videos by yourself.

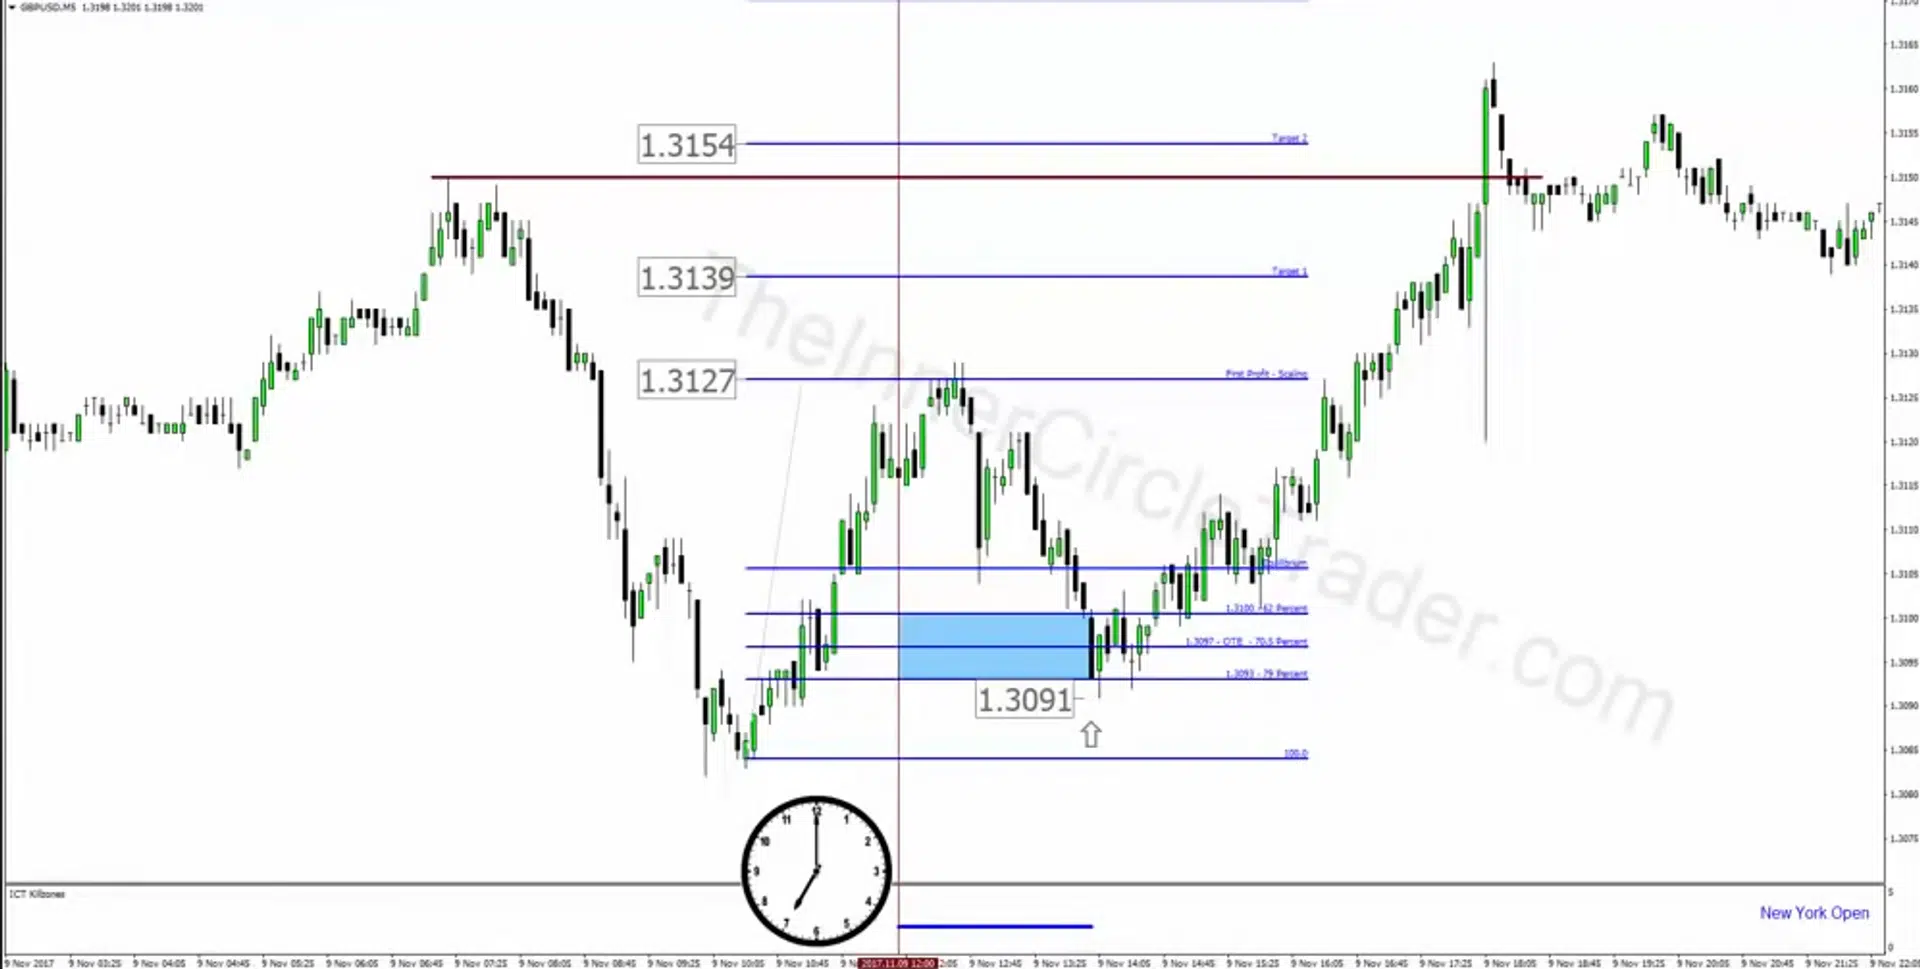
M15 CHART
- The left side to the middle vertical line is the previous day, and the right side is the day where we can look for longs
- The green horizontal line is PDH
- We use session highs and lows of the previous day to find our optimal trade entries (as mentioned in Vol 1)
- We are only interested in trading when the price reaches the optimal entry
ICT power of 3 concepts
When the daily bias is bullish:
- 3 components that make up generic price action
- Accumulation phase – longs or shorts accumulated
- Manipulation phase – price goes opposite direction to what the intended future direction will be
- Range expansion / Distribution


- Confirm London session was bullish
- The measure of bullishness after an attempt to go lower was rejected and the price has seen a rally + Daily bias bullish
- Wait for 7 AM NY time to stalk for long
- Between 7 AM – 9 AM NY time, setup will typically form
- After 7 AM NY time, wait for price retracement lower
- NY session will typically retrace from a swing high intraday that was formed for a daily high or a short-term high during the London session
- Ideally, select retracements of at least 20 pips lower
- If no retracement of 20 pips form by 9 AM – don’t take anything
- If it does form – enter 62% fib as it drops
- Expect the price to retest the high of the day or the previous day’s high ⇒ Look for targets 1 & 2 on the fib
When the daily bias is bearish:
- 3 components make up generic price action
- Accumulation phase – longs or shorts accumulated
- Manipulation phase – price goes opposite direction to what the intended future direction will be
- Range expansion / Distribution


- Confirm the London session was bearish
- Want to see the price move above the opening price at midnight NY time then reject and go lower ⇒ Should anticipate the idea of the NY session continuing in bearish conditions
- Wait for 7 AM NY time to stalk for shorts
- Between 7 AM – 9 AM NY time, setup will typically form
- After 7 AM NY time, wait for price retracement
- NY session will typically retrace from a swing low intraday that was formed for a daily low or a short-term low during the London session
- Ideally, select retracements of at least 20 pips higher
- If no retracement of 20 pips form by 9 AM – don’t take anything
- If it does form – enter 62% fib as it rallies
- Expect the price to retest low of the day or the previous day’s low ⇒ Look for targets 1 & 2 on the fib
EXAMPLE
- The vertical line denotes 7 AM NY time

When to expect reversals
- When the H1 chart trades to an obvious old high or old low that has shown a clear willingness to reverse price before – this will likely repeat
- Sometimes the price will not respect an old high or low and those generic S&R levels will give way and we never know for sure
- Far better to expect them to cause a reaction than not to ⇒ Plenty of moves and price swings between these key HTF price points to never have to worry about them

Money management
- Important to implement strict risk controls
- Consider using 0,5% per setup and gradually working your way up to 2% if it meets your “risk tolerance”
- Important not to try to swing home runs or take larger risks. One trade will not make you rich.
- Over-leverage will impede your development and drastically decrease your chances of seeing responsible equity growth
- Rather focus on consistent build-up of your account
*Note: this is my personal notes from the ICT’s video. I have screenshotted and noted what is important for my studies I recommend watching the videos by yourself.